- 中
- +86 13732210605
Author:CHNSpec technology
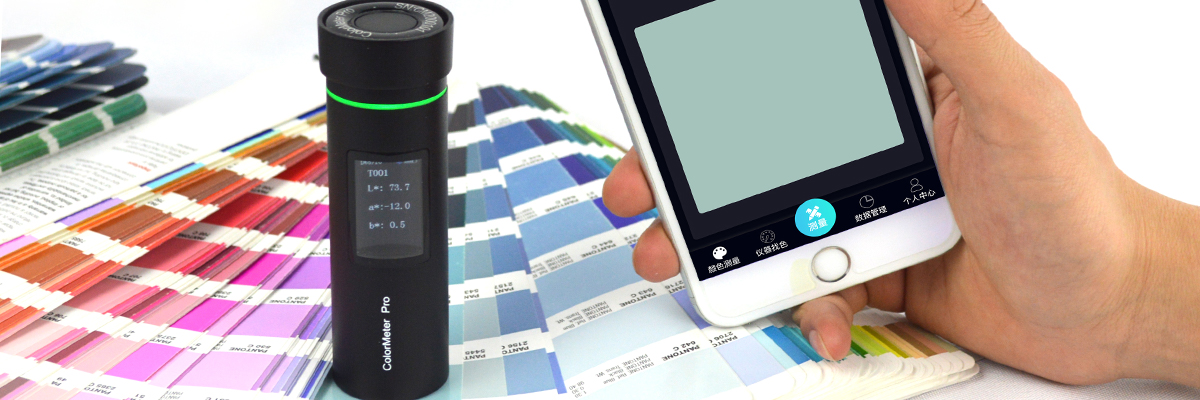
In the textile industry, the requirements for color difference are particularly high, so we also pay special attention to the color difference of raw materials. Generally, textile mills test the whiteness and color difference of raw materials. Whiteness generally uses Hunter whiteness (WH), Ganz whiteness (W) and color (TW) to measure the whiteness value of cotton. Because Ganz whiteness w has high requirements for whiteness, the substance can not be measured with a little color. When we measure cotton, we measure its Hunter whiteness wh. The larger the wh value, the whiter the whiteness of the measured object. The color difference instrument is generally selected as the color measuring instrument. Today, the instrument in our experiment is CS-660 spectrophotometer of CHNSpec technology.

CS-600 spectrophotometer
When measuring color difference, use Δ L、 Δ a、 Δ b、 Δ E refers to the corresponding quantity difference and color difference △ e calculated by CIE1976 Lab (CIE1976 is the standard for color measurement unified by the international lighting Committee in 1976)
Where l * represents lightness and a * b * represents chromaticity coordinate value.
When △ e = 1, it is called one NBS color difference unit, and one NBS color difference unit is about 5 times the sensitivity that human eyes can perceive under good experimental conditions. As for the scope of product color difference, it should be determined according to the specific situation. For example, the color difference of textiles is obvious when there is a slight difference, and the allowable color difference should be controlled within several NBS units (in the color difference group, the difference is obtained by subtracting the standard sample from the compared sample).
As shown in the figure, the Hunter whiteness of cotton has been tested and verified to be normal distribution in a factory for more than half a year. The whiteness analysis results of 50 batches of cotton samples are shown in Table 1:
Table 1

Calculate the range of w h and △ e of cotton. The maximum whiteness w h = 63.69 and the minimum whiteness w h = 53.47
Range R = 63.69-53.47 = 10.22.
Color difference △ e max = 14.49, min = 9.56
Range R = 14.49-9.56 = 4.93.
The above data shows that most of the colors of cotton are close. Generally, the Hunter whiteness of cotton is basically in the range of 55-63, the most is wh = 59, and wh > 59. The closer cotton is to white; When wh < 59, the more cotton deviates from white, or more accurately, it approaches yellow. With these data, we can basically make a preliminary judgment. When replacing raw cotton in normal use, we should consider that the whiteness index should be controlled at wh = 57-61.
Then we compare the data of cotton whiteness and color difference measured by CS-660 spectrophotometer with human eye test to prove that it can correctly distinguish white and express the degree of white with data? We measured a total of 200 batches of raw cotton. According to the visual measurement, there are 48 batches of raw cotton with "white" color. The Hunter whiteness wh measured by the instrument is generally more than 59, and the color difference △ e is generally less than 1. According to the visual evaluation, there are 21 batches of raw cotton with "sub white" color. According to the instrument, w h is generally, 56-57, and the color difference △ e is generally about 12-13. According to the visual evaluation, there are 7 batches of raw cotton with "milk yellow" color, The wh measured by the instrument is generally below 56, and the color difference △ e is generally above 13. Therefore, the color difference degree of cotton can be known by using the color difference meter, and it can be used as one of the basis for controlling the composition of cotton blending.
How to use the two indexes of Hunter whiteness and color difference of cotton, and what kind of data are used to control the cotton blending composition? We then conducted correlation analysis on the data of wh and △ e (compared with the standard sample version) measured by 20 batches of cotton. As shown in Table 2.
Table 2

Number of relationships: r = -0.974
freedom Φ= n-2=20-2=18
Check 1% table R1 = 0.561 / R / = 0.974 > R1
5% table R2 = 0.444 / R1 / 0.974 > R2

Correlation analysis diagram
The above analysis shows that there is an obvious strong negative correlation between wh and AE in cotton. Therefore, no matter the whiteness value wh and color difference value △ e are used, they can express the chromaticity of the measured object, and can be used to control cotton blending, so as to reduce color difference and improve quality.