- 中
- +86 13732210605
Author:Spectrophotometer
Color difference detector can help enterprises control the color of noodles, so as to control the quality of noodles. The color difference detector can also help enterprises establish a color management system, replace human eye judgment with data, and establish the evaluation method of noodle quality through the color difference detector to improve product quality.
With the development of wheat flour processing industry, consumers' first impression of noodles is color, which directly affects people's judgment of the quality of noodles. The color of noodles has gradually become an important sensory evaluation index. At present, sensory evaluation is still the main method of noodle quality evaluation. However, the sensory evaluation of noodles has high requirements for reviewers, and there are many factors affecting the evaluation. The results of identification in different regions and laboratories may be quite different. Using the color difference detector to determine the color of noodles is helpful to objectively evaluate the quality difference of noodles and reduce human error.
At present, the commonly used method to represent color is L * a * b * color space method, where l * is the brightness of sample color; A * b * is the color direction, + A * is the red direction, - A * is the green direction, + b * is the Yellow direction and - B * is the blue direction. It can not only be used to test the whiteness of flowable powdered wheat flour, but also give an objective quantitative evaluation on the surface whiteness, brightness, whiteness and luster of internal structure of finished products. Through the synthesis of L *, a *, b *, it can fully reflect the deviation of surface chromaticity or internal organization of noodles, pasta and other foods, So as to more accurately compare the color difference between different samples. The application of color difference detector in sensory evaluation of noodles was studied by measuring the color of wheat flour, raw dough and cooked dough.
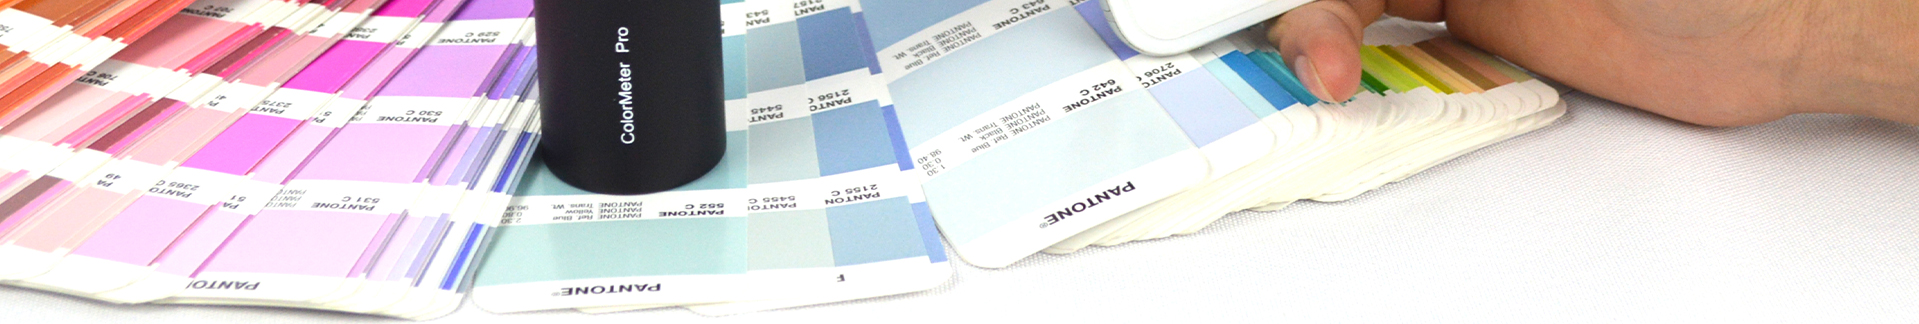
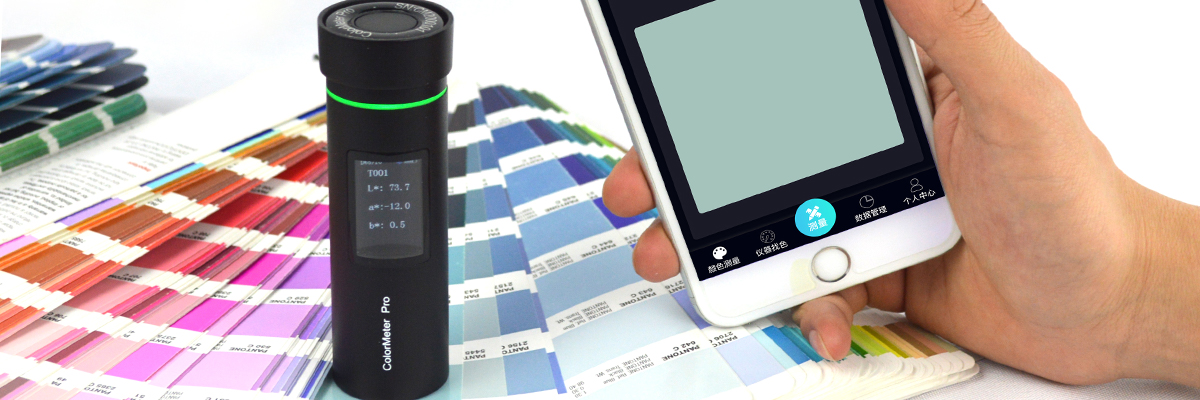
222 representative wheat samples were selected. Wheat samples were distributed in 108 wheat varieties in 10 provinces in the main wheat producing areas of China. Wheat flour was processed into noodles for sensory evaluation. The experimental instrument adopts ds-700d color difference detector of CHNSpec technology. Ds-700d color difference detector is an excellent spectrophotometer in China. The built-in software has powerful functions, including all necessary color equations, standard light sources suitable for different tasks, and a large number of indicators for specific industries and applications.

Spectrophotometer
The color difference detector directly measures the color of noodles and requires special tools. We use noodles instead of noodles. Take the two freshly prepared dough pieces and put them into the sealed pocket and store them in a 25 ℃ incubator. Measure the color of the raw dough pieces after 0.5 h and 24 h respectively; Put the dough pieces placed for half an hour into boiling water and cook for about 6 minutes. Take them out and immerse them in ice water for 10 seconds, and then measure their color as the color of the cooked dough pieces; Each sample shall be tested at different points of the dough for three times, and finally the average value shall be taken (the noodles with high-quality color shall be bright yellow or bright white).
The statistical values of the samples are shown in Table 1. It can be seen that after the dough is placed for 24 hours, the L value of the dough decreases, the a value increases, and the b value changes little. It shows that the color of dough changes to dark and red with the extension of placement time. The standard deviation of L value and a value increased and b value decreased after the dough was placed for 24 hours, indicating that the extension of placement time will expand the difference of L value and a value between samples and reduce the difference of B value between samples.
Table 1 statistical values of various indicators of samples
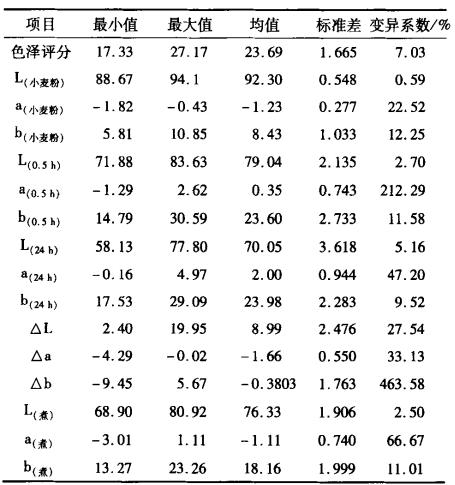
Note: (wheat flour) is wheat pink; (0.5 h) is the color of the epigenetic patch after 0.5 h; (cooking) the color of the cooked slices; (24 h) refers to the color of the dough after 24 h; △L=L(0.5 h)-L(24 h); △a=a(O.5 h)-a(24 h); △b=b(O.5 h)-b(24 h)。
After the dough slices are cooked, the three indexes are reduced, the dough will darken, and the red and yellow will decrease. After cooking, the standard deviation of L value and b value decreases, and the standard deviation of a value remains unchanged, indicating that the difference in color between dough pieces is reduced after cooking.
As shown in Table 2, the test value of wheat pink luster is highly significantly correlated with the sensory score, in which the a value of wheat flour is negatively correlated with the sensory score, while the L value is positively correlated with the b value, indicating that the sensory score of wheat flour with high brightness, yellowish and low redness value is high. The data of patch color were significantly correlated with sensory score. △ L has a very significant negative correlation with sensory score. The change range of L value is small after 24 hours, and the score of noodle color is often high; There is a very significant positive correlation between △ A and sensory score, in which △ A is a negative value, which also shows that the smaller the change range of a value, the higher the noodle color score. It can also be seen from table 2 that the noodles with high color score are placed for 24 hours.
Table 2 Correlation Analysis between wheat pink luster, dough color and noodle sensory evaluation color score

Note: * significant correlation at 0.05 level** Significant correlation at the level of 0.01, extremely significant correlation.
Stepwise regression method was used to establish multiple linear regression equations. Seven multiple regression equations were established, and the color difference meter was used to replace the color score in sensory evaluation. Taking the color of 0.5h, 24h and boiled noodles as independent variables, the maximum determination coefficient R2 of the regression equation is 74.1%.
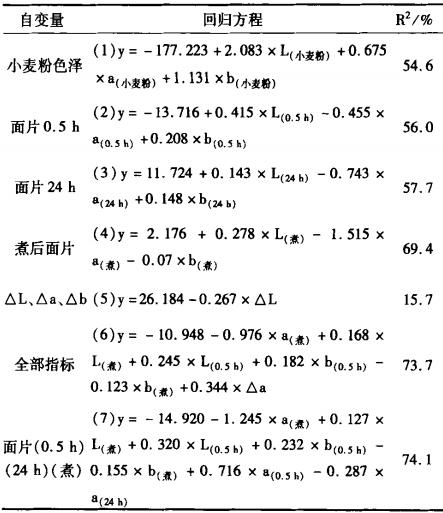
The color of wheat flour can predict 54.6% of the sensory evaluation color of noodles. Comparing the above seven equations, the accuracy of equation (7) is high, reaching 74.1%, but it is necessary to test the color of dough slices after 0.5h and 24h. Considering the simplicity of test operation and the effect of equation prediction, equation (4) can be selected for instrumental evaluation of noodle color. Multiple regression equation (4) can explain 69.4% of the total variation of noodle sensory evaluation color score.
Table 4 statistical comparison between equation value and actual value
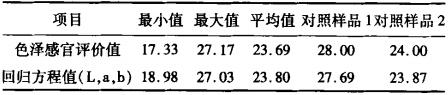
It can be seen from table 4 that equation 4 can well replace the color in the sensory evaluation of noodles. Bring the color L, a and B of the boiled slices of the control sample into equation 4. The result of the equation is the same as the color value of sensory evaluation. Therefore, we can choose the equation (4) composed of the color of boiled slices: color y = 2.176 + 0.278 × L (boiled) - 1.515 × A (boiling) -0.07 × B (cooking) used for instrumental evaluation of noodle color. This equation can replace the naked eye to evaluate the color of noodles. The color difference detector can better control the color of products. The color difference detector can help enterprises carry out efficient operation.