


In modern manufacturing, "color" is a critical metric that defines product quality and brand integrity. Whether in plastics, coatings, textiles, or printing, a slight color variation can lead to product rejection and significant financial losses.
To quantify and manage color precisely, quality control (QC) teams worldwide rely on colorimeters or spectrophotometers. However, when you receive a data sheet showing L*, a*, b*, and ΔE values, do you know how to interpret them?
This guide will demystify these color measurements to help you master color inspection.
I.What is the CIE L*a*b* Color Space?
The most widely used mathematical color model in global industry is the CIE L*a*b* color space (commonly referred to as the Lab space), established by the International Commission on Illumination (CIE) in 1976. It is a 3D color space defined by three perpendicular axes:
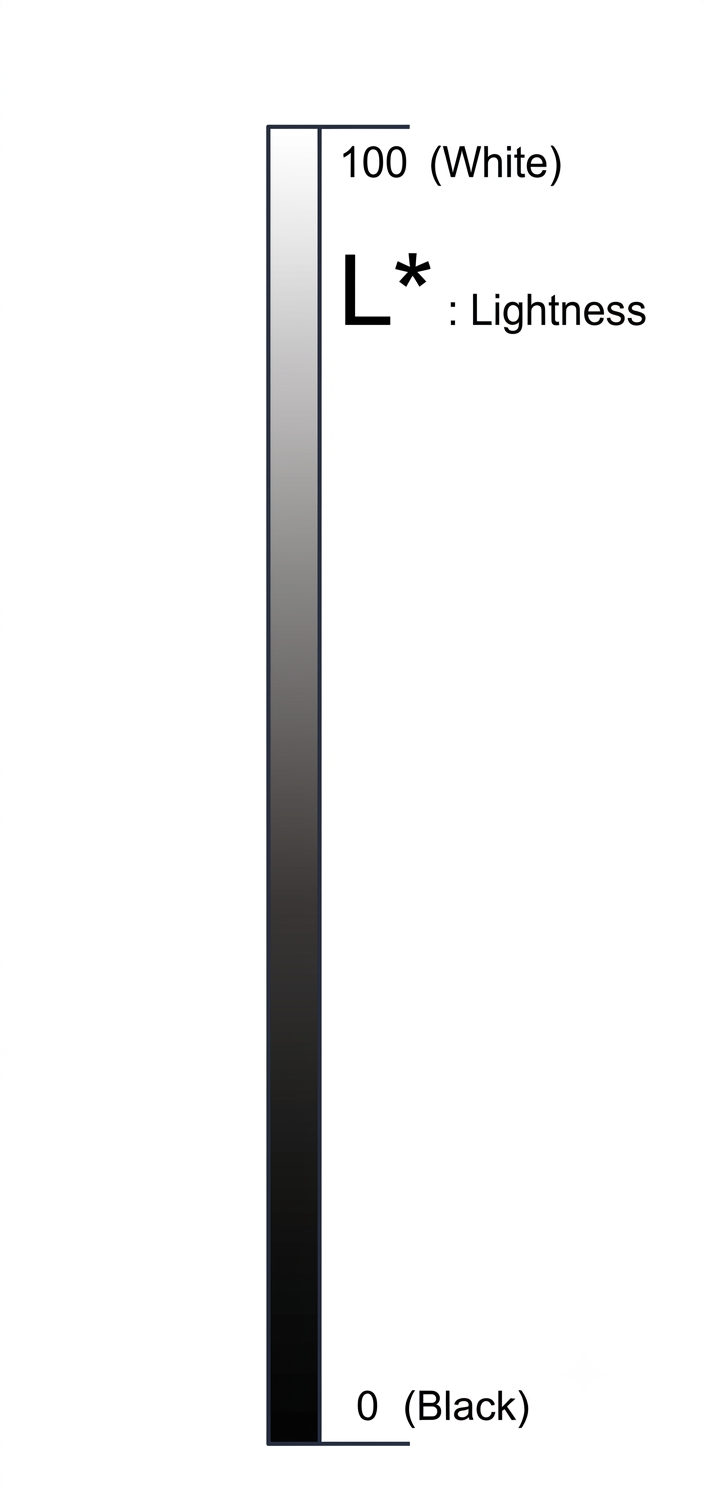
1.L*(Lightness Axis): Represents how light or dark a color is.
L*= 100 indicates pure white.L*= 0 indicates pure black.
2.a*Red-Green Axis): Represents the red/green chromaticity.
Positive values (+a*) trend toward Red.Negative values (-a*) trend toward Green.

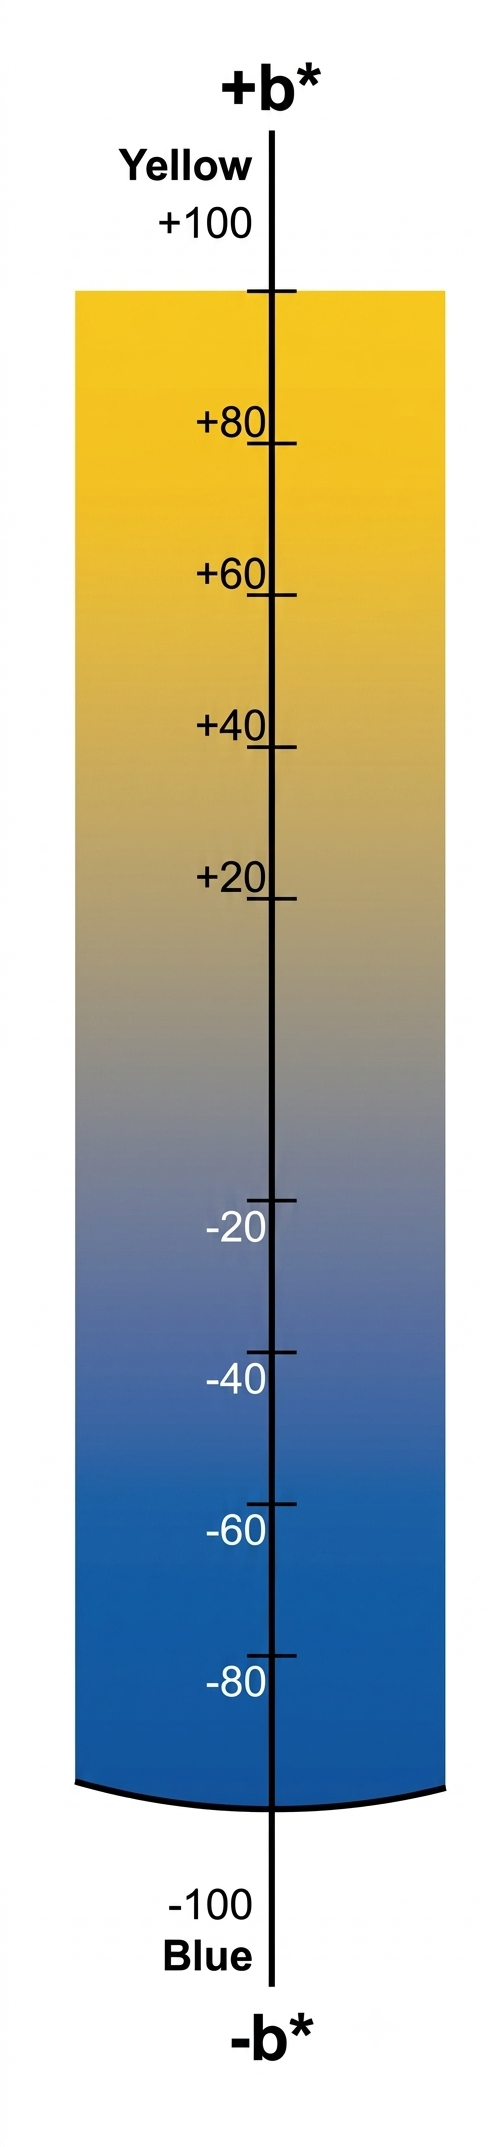
3.b* (Yellow-Blue Axis): Represents the yellow/blue chromaticity.
Positive values (+b*) trend toward Yellow.Negative values (-b*) trend toward Blue.
II.How to Read Δ(Delta) Values on a Colorimeter?
In real-world quality control, we rarely look at absolute L*, a*, b* values in isolation. Instead, we compare a Sample against a target Standard. The differences are represented by the Greek letter Δ (Delta):
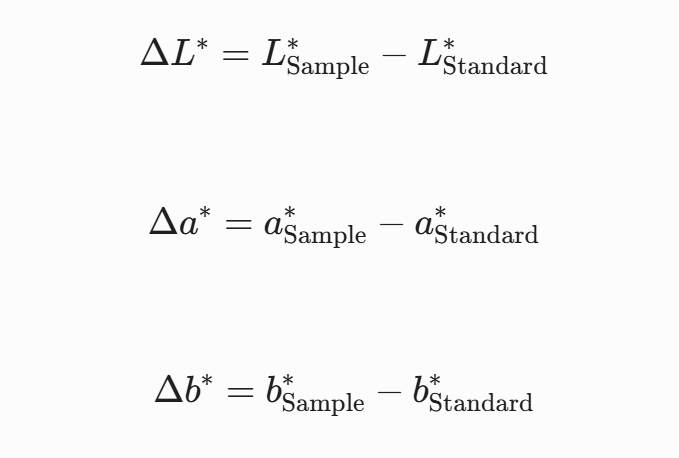
1.Interpreting +/- signs for ΔL*, Δa*, and Δb*:
|
Metric |
Meaning of Positive (+) Value |
Meaning of Negative (-) Value |
|
ΔL* |
Brighter/Whiter (The sample is lighter than the standard) |
Darker/Blacker (The sample is darker than the standard) |
|
Δa* |
Redder (More red/less green) |
Greener (More green/less red) |
|
Δb* |
Yellower (More yellow/less blue) |
Greener (More green/less red) |
Practical Example:
If your colorimeter shows: ΔL*= +0.5, Δa* = -1.2, Δb* = +0.8.
Interpretation: The sample color is slightly lighter, greener, and yellower than the standard target.
III.What is ΔE (Total Color Difference)?
ΔE represents the total color difference. It is calculated as the straight-line distance between the sample and the standard in the 3D CIE Lab color space using the Pythagorean theorem:

ΔE compresses all deviations in lightness, red/green, and yellow/blue into a single, easy-to-understand number. Global buyers and suppliers typically establish a specific ΔE limit in their contracts as the Pass/Fail threshold.
ΔE Range & Human Visual Perception:
- ΔE < 0.2:Indetectible by the human eye. Typically used as the inter-instrument agreement benchmark for high-end spectrophotometers.
- 0.2 < ΔE < 1.0:Extremely small difference. Only trained color experts can barely notice it under specific controlled lighting.
- 1.0 < ΔE < 2.0:Slight difference. Hard to notice unless the sample and standard are placed directly side-by-side. This is the accepted limit for most consumer products.
- 2.0 < ΔE < 4.0:Perceptible difference. Even untrained eyes can spot the variation immediately.
- ΔE > 4.0:Obvious, significant color mismatch. Usually results in product rejection.
IV. Elevate Your Quality Control: CHNSpec Color Measuring Instruments
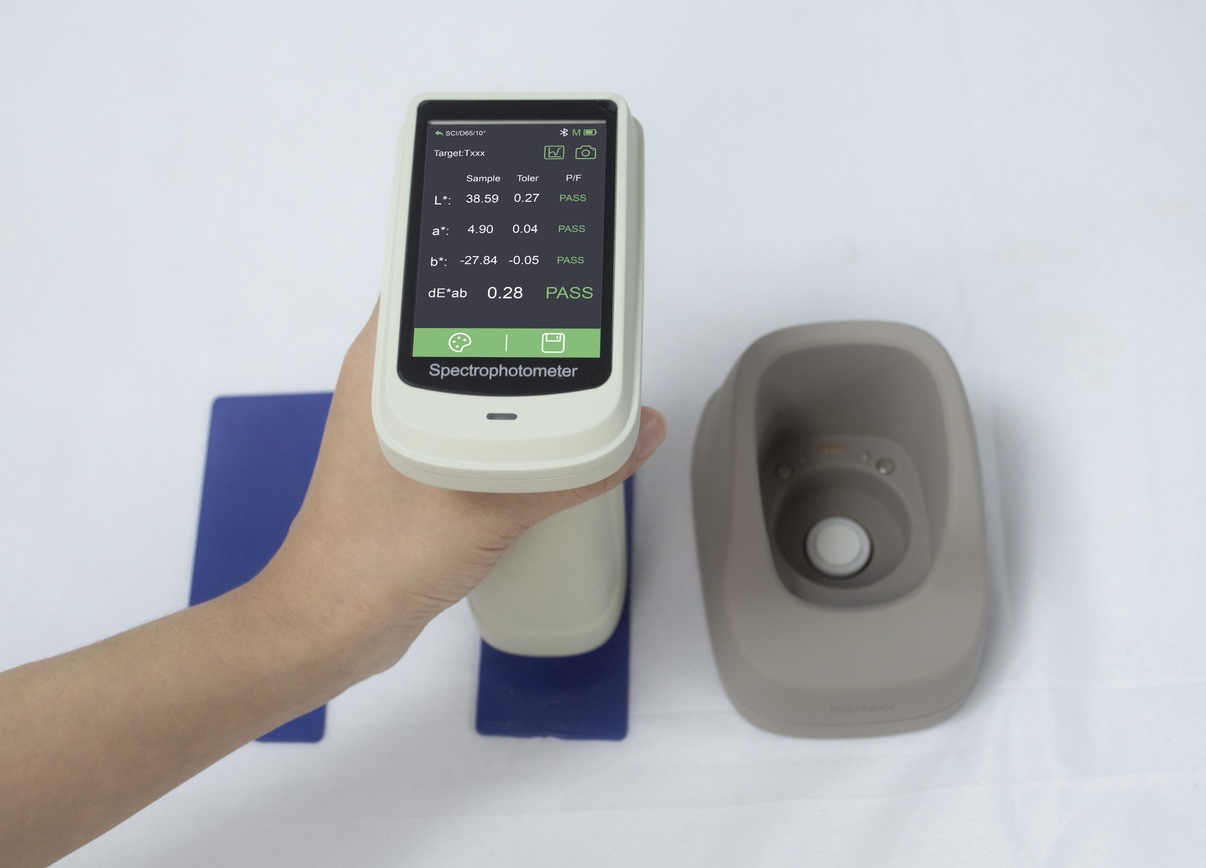
1. Portable Spectrophotometer: CHNSpec DS-700D
If you need fast, on-the-go measurements on the factory floor, in the warehouse, or during client site visits, the CHNSpec DS-700D is your ideal choice.
- High Metrological Accuracy: Features a repeatability of ΔE*ab ≤ 0.025 and an inter-instrument agreement of ΔE*ab ≤ 0.25 (Metrology Level I).
- Versatile Apertures: Comes with 3 switchable apertures (MAV, SAV, MINI) to measure anything from broad flat plastics to tiny curved parts.
- Smart App Connectivity: Connects seamlessly via Bluetooth/USB to Android, iOS, and Windows devices for instant data storage and QC reporting.
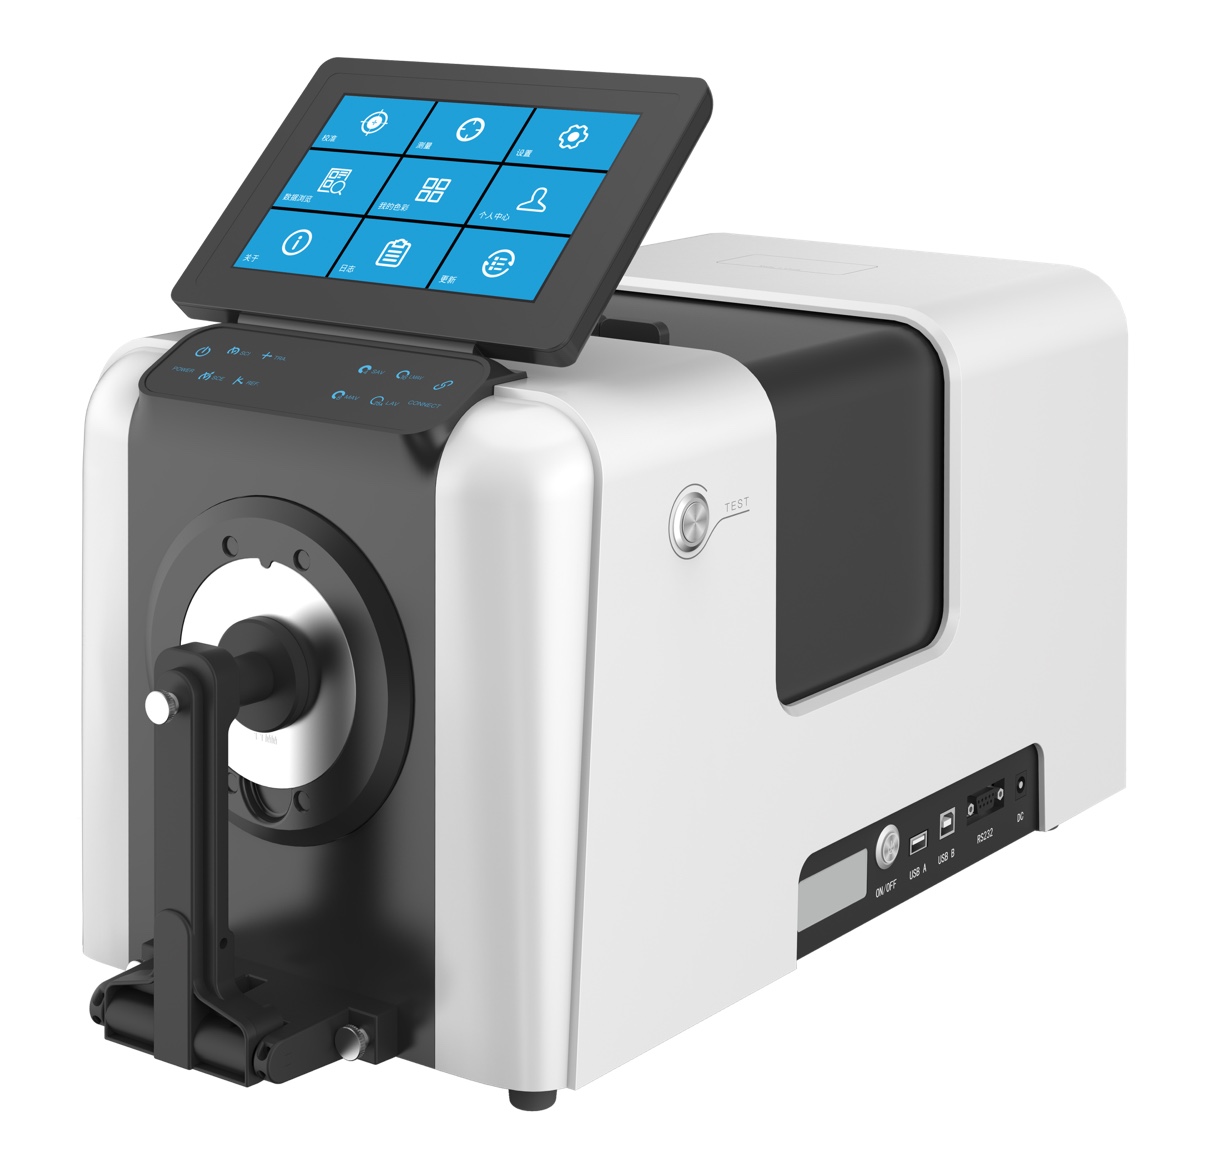
2. Benchtop Spectrophotometer: CHNSpec DS-36D
Designed for laboratory research, color matching departments, and core QC divisions where absolute precision is non-negotiable.
- Advanced Optical Design: Employs a dual optical path design utilizing a differential spectrum engine and nanoscale grating to eliminate environmental interference.
- Superb Inter-Instrument Agreement: Ensures all instruments across your global supply chain generate highly consistent, digital color data.
V. Summary
Mastering how to interpret colorimeter data helps identify color deviations early in the production process, thereby reducing the risk of rework. In international trade communications, utilizing objective metrics such as Lab and ΔE allows you to establish clear, consistent color evaluation standards with global clients.
CHNSpec 's spectrophotometers provide reliable data support for your color quality control, making the entire process more scientific and efficient. To obtain a customized color management solution, please feel free to contact us at any time.